Test history & analysis
Every run is recorded in the History table on the Test runs screen, and each finished run can be opened in the run viewer for analysis. Runs start from the New test panel on the Control screen.
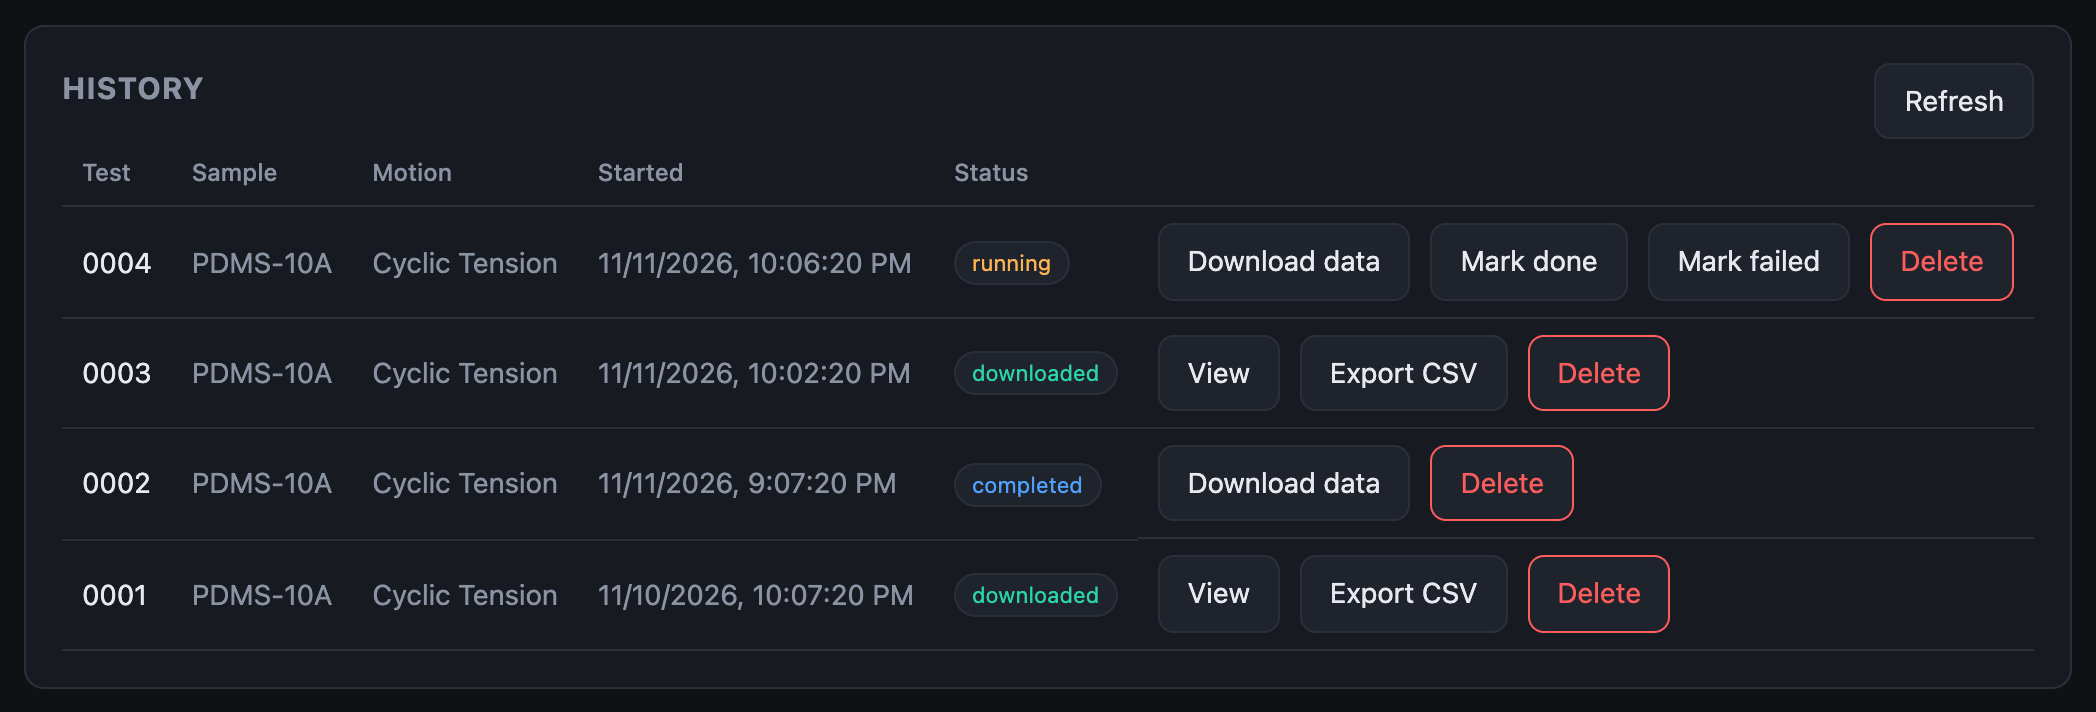
The history table
Each row shows the test name, the sample and motion profile names, the start time, and a status badge:
| Status | Meaning |
|---|---|
running |
The test is in progress |
completed |
The motion finished; data is on the machine but not yet downloaded |
downloaded |
The CSV has been pulled to your data folder and can be viewed |
error |
The run failed to start, was marked failed, or recorded no data. The reason shows under the badge. |
Row actions:
- Download data — pull the recorded CSV off the machine (a progress bar shows transfer). Status becomes downloaded.
- View — open the run viewer (available once downloaded).
- Export CSV — save the CSV (with a metadata header) to a file.
- Delete — remove the run (with a confirmation dialog).
- Mark done / Mark failed — resolve a run stuck in running.
A run that finishes while you are on another screen updates here by itself.
Use Refresh to reload the table, and load older runs to page through history.
The run viewer
Click View to open the analysis for a run:
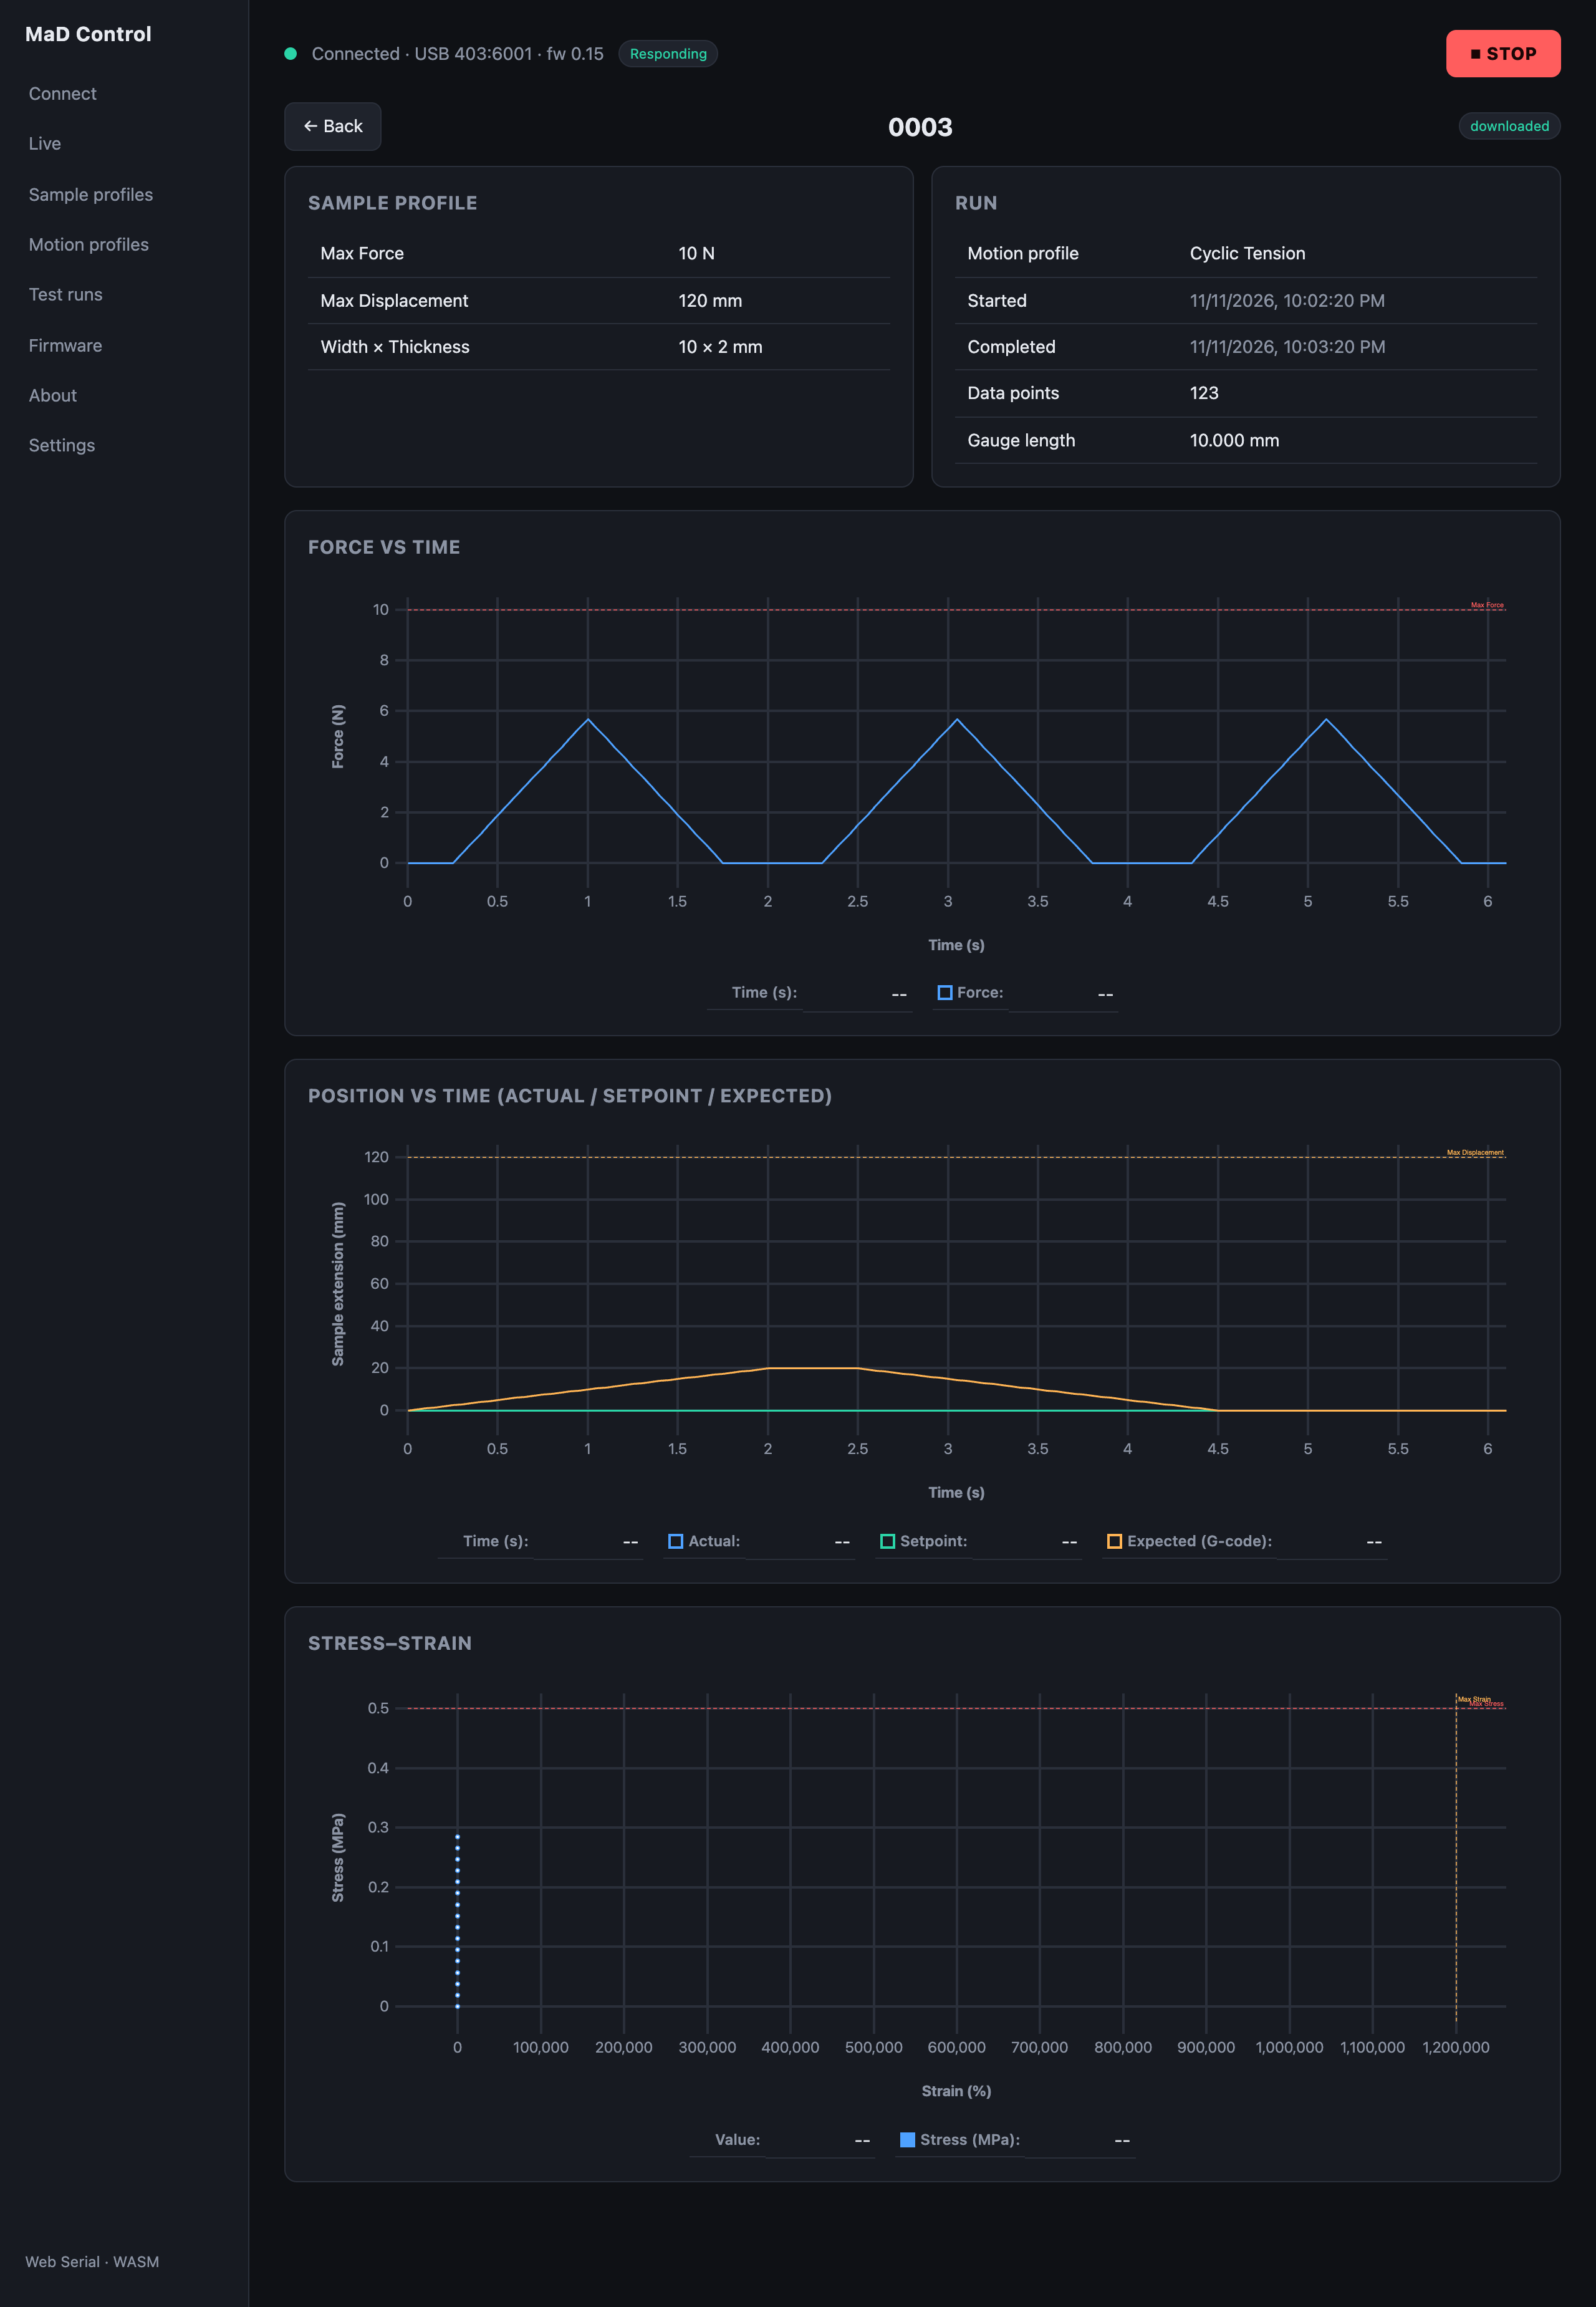
It shows:
- Info cards — the sample-profile details and run details (motion profile, start/complete times, number of data points, gauge length).
- Force vs time — the recorded force with a Max force reference line.
- Position vs Time — where the jaw actually went, what the machine was commanding, and what the motion profile expected, with a Max displacement reference line. Divergence between the three is the quickest way to spot a slipping grip or a limit being hit.
- Stress–strain — stress (σ = |F| / (width·thickness), MPa) against strain (ΔL / gauge length, %), with Max Stress / Max Strain limit lines.
The Y axes fit the recorded data. Drag across a chart to zoom into that stretch, hover to read the values under the cursor, and use the reset button to zoom back out. A run that finished without any data shows why instead of the charts.
The data
Results are stored as CSV in your data folder, so you can open them in a spreadsheet or analysis tool. The run viewer and the Export CSV action both show values in the usual units (N and mm); the raw CSV records them in finer units, so expect larger numbers if you open the file directly. File formats has the exact column layout.